
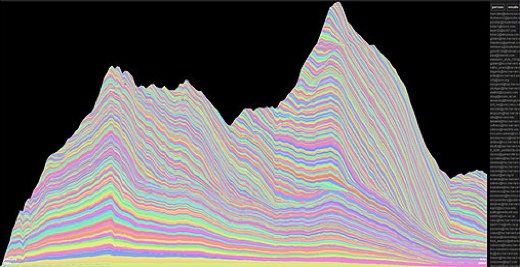
Fernanda Viégas, a Ph.D. candidate at the Sociable Media Group at the M.I.T. Media Lab has developed an attractive visualization tool for email archives. Appropriately, she chooses the metaphor of a mountain. Colors, like rock layers, represent the various people you have kept up with. The more recent contacts are toward the peak.
It’s terrifying to think of all the email I have generated and received since I first started corresponding electronically in the mid-90s. If they were letters stuffed in shoe boxes, they would probably fill a house. Some of those shoe boxes have been vaporized (I lost a lot of my college letters (probably for the best) when my student accounts were closed. And now, probably foolishly, I use webmail, which could vanish just as easily.
A vast majority of letters are transient things, hardly worth a second look, let alone saving. But some can turn out to be valuable keys to the past – a way to unlock a mind or a relationship from an earlier time. Collected letters have always been an invaluable tool for literary and historical studies. But since letter writing is an all but dead practice, we must turn to emails for epistolary evidence. And not just email, since today’s communication practices are so diverse. Text messages, instant messenger chats, phonecalls, video conferencing – these are all avenues for our social selves. 99% may be vapor, but it would be sad to lose that salient 1% that gives flight to memory.
I came across a new program (not free) that records Skype conversations as .mp3 files. Skype is a free VoIP program (voice over internet protocol) that probably spells ultimate doom for traditional phone services. Years later, assuming your hard drive hasn’t been wiped and the file format is still readable, plug in your headphones and listen to your collected letters.
(“Mountain” via Smart Mobs via Information Aesthetics – not to be confused with, though highly related to, Information Esthetics)
Author Archives: ben vershbow
new york times to integrate print and online newsrooms
This speaks volumes. From a recent staff memo at the Times:
“By integrating the newsrooms we plan to diminish and eventually eliminate the difference between newspaper journalists and Web journalists.”
(see free story in WSJ)
blog posting volume also on the rise
More interesting findings from Technorati’s “state of the blogosphere” report. This installment focuses on “posting volume,” or how active the active 55% of the world’s 14.4 million blogs really is. The study shows a clear and steady increase in the average posting rate across the blogosphere. The graph below shows how volume has spiked in response to certain events, from Howard Dean’s infamous scream following the Iowa primary to the July 7 London bombings.

new curatorial machinery on flickr
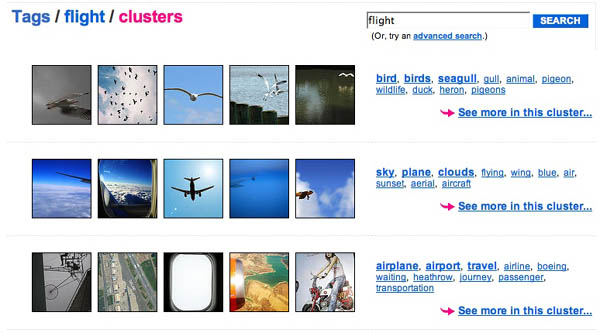
Clusters
Flickr has unveiled a pair of new tools for sifting through its 31 million images. The first is tag clustering, which breaks up single-term tag searches into clusters based upon patterns among coinciding tags. For instance, a search for “flight” yielded three clusters (see screenshot below): one with a preponderance of birds, one with shots of airplanes, and a third with general scenes of air travel. A search for Europe might yield separate clusters for France, Italy, and Germany, and might also set apart images with a high incidence of cathedrals.
Tagging has always been central to the Flickr experience, but given the incredible volume of images, it goes only so far in helping one dig out items of interest. There is always the option of an advanced search, which narrows down a query to images that have two or more tags in common. But tagging is an idiosyncratic business and the more refined the search, the more brilliant your guesswork must be.
Clusters aren’t a bad alternative. They find a middle ground between the single tag avalanche and the razor-sharp advance search, turning up groups with nice, fuzzy affinities. From now on, I might check clusters before moving on to an advanced search.
Interestingness
One unfortunate fact in Flickr (and the web in general) is the brutal hierarchy of time. The more recent a thing is, the easier it is to find. More a pile-up than an archive, it’s difficult to get to anything that’s not in the vicinity of the upper layers. Recognizing this, Flickr has initiated a Google-style ranking system called “interestingness.”
Carrying on the Flickr tradition of cute, exuberant terminology, “interestingness” is based on an algorithm that ranks images on a kind of impact index, judging by number of times viewed, number of times marked as “favorite,” number of comments, diversity of click-throughs, etc. For any given day of any given month, you can see what the algorithm has determined to be the 500 most interesting images. You can also sort tag search results by “most interesting,” and can even see what the algorithm thought of your own personal photostream.
When it came to my own images, I found the machine to be a poor curator, since what I consider to be my most interesting images have, for whatever reason, been viewed less frequently. A popularity contest does not always award the most deserving. But looking at the monthly exhibits, its hard to deny the quality of the selection. I highly recommend visiting the “explore” page.
n.y. times examines “the digital student”
With August comes the ritual back-to-school mania, and fittingly, there’s a large special section in today’s Times on the “digital student.” At a glance, it seems to focus heavily on gadgets – a sort of fashion spread for the accessorized student – but there are also articles looking at social software in the classroom and new pedagogical methods. Could be interesting.
every second, a new blog is born
There’s a good “state of the blogosphere” post up on Technorati. According to the latest analysis, there are approximately 14.4 million blogs, and that number is on track to double every 5.5 months, with a new blog created each second. A noteworthy statistic, and one that has remained constant for at least a year, is that approximately 55% of blogs are active. So, high rate of birth, and high rate of stagnation. That’s the web.
rollable paper-like screens
![]()
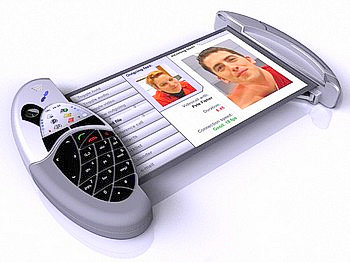
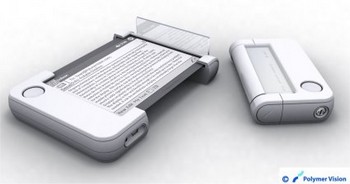
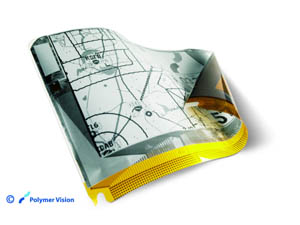
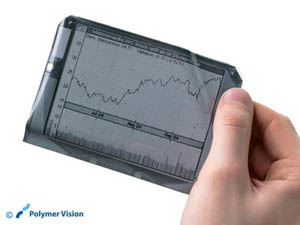
Some future fantasy fare from Polymer Vision, a subset of Philips. These screens are paper-thin and use e-ink to produce a reflective display that consumes little power and can be read in sunlight. Read a book and then roll it back up into your phone. This stuff is only a few years off.
![]()
More info from Philips.
lexis nexis as multimedia library
 Lexis Nexis, an indispensable resource for the more-than-casual web researcher, announced it will be adding video to its news and archive database, as part of its pay-as-you-go AlaCarte service. Clips will cost a few bucks a piece, more or less what a text article does now, and can be emailed to other readers for an extra fee.
The service will be powered by Critical Mention, a Manhattan start-up with a growing video database and several big licensing agreements already under its belt. The move into video parallels recent developments at Google, and particularly Yahoo!, whose video search engine makes it easier to track down clips across the web. But Lexis Nexis will be aimed at more rigorous researchers, primarily businesses, universities, and government agencies.
This brings a broadcast medium into what has traditionally been textual territory, underscoring some of the big questions: what does it mean to “write” with video? What does it mean to “quote” video?
(image: Critical Mention)
zoom quilt
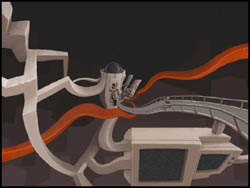 Dan came across another nice example of a zooming interface, which we believe suggests a new spacial conception of the page. The “Zoom Quilt” is a playful piece, apparently the fruit of a collaborative art project. I can imagine this working wonderfully for a children’s book. I wish, though, that the path could fork.
For more on zoom:
“infinite canvas comics”
“the page as a spandrel (or not)”
e-slates in kenya
A pilot program in Kenya gives 54 fifth grade students pocket PCs in lieu of textbooks (BBC story). Known in the school as “e-slates,” the handheld computers run on open source software and contain digitized print textbooks, but could eventually support multiple media materials. The whole classroom is connected through a wireless network, which allows texts to be updated seamelessly, and may ultimately enable homework assignments to be passed between teacher and pupil without a single sheet of paper. But that will depend on a reliable network connection and a steady supply of electricity, neither of which are a given.