
The NEA claims it wishes to “initiate a serious discussion” over the findings of its latest report, but the public statements from representatives of the Endowment have had a terse or caustic tone, such as in Sunil Iyengar’s reply to Nancy Kaplan. Another example is Mark Bauerlein’s letter to the editor in response to my December 7, 2007 Chronicle Review piece, “How Reading is Being Reimagined,” a letter in which Bauerlein seems unable or unwilling to elevate the discourse beyond branding me a “votary” of screen reading and suggesting that I “do some homework before passing opinions on matters out of [my] depth.”
One suspects that, stung by critical responses to the earlier Reading at Risk report (2004), the decision this time around was that the best defense is a good offense. Bauerlein chastises me for not matching data with data, that is for failing to provide any quantitative documentation in support of various observations about screen reading and new media (not able to resist the opportunity for insult, he also suggests such indolence is only to be expected of a digital partisan). Yet data wrangling was not the focus of my piece, and I said as much in print: rather, I wanted to raise questions about the NEA’s report in the context of the history of reading, questions which have also been asked by Harvard scholar Leah Price in a recent essay in the New York Times Book Review.
If my work is lacking in statistical heavy mettle, the NEA’s description of reading proceeds as though the last three decades of scholarship by figures like Elizabeth Eisenstein, Harvey Graff, Anthony Grafton, Lisa Jardin, Bill Sherman, Adrian Johns, Roger Chartier, Peter Stallybrass, Patricia Crain, Lisa Gitelman, and many others simply does not exist. But this body of work has demolished the idea that reading is a stable or historically homogeneous activity, thereby ripping the support out from under the quaint notion that the codex book is the simple, self-consistent artifact it is presented as in the reports, while also documenting the numerous varieties of cultural anxiety that have attended the act of reading and questions over whether we’re reading not enough or too much.
It’s worth underscoring that the academic response to the NEA’s two reports has been largely skeptical. Why is this? After all, in the ivied circles I move in, everyone loves books, cherishes reading, and wants people to read more, in whatever venue or medium. I also know that’s true of the people at if:book (and thanks to Ben Vershbow, by the way, for giving me the opportunity to respond here). And yet we bristle at the data as presented by the NEA. Is it because, as academics, eggheads, and other varieties of bookwormish nerds and geeks we’re all hopelessly ensorcelled by the pleasures of problematizing and complicating rather than accepting hard evidence at face value? Herein lies the curious anti-intellectualism to which I think at least some of us are reacting, an anti-intellectualism that manifests superficially in the rancorous and dismissive tone that Bauerlein and Iyengar have brought to the very conversation they claim they sought to initiate, but anti-intellectualism which, at its root, is – ?just possibly – ?about a frustration that the professors won’t stop indulging their fancy theories and footnotes and ditzy digital rhetoric. (Too much book larnin’ going on up at the college? Is that what I’m reading between the lines?)
Or maybe I’m wrong about that last bit. I hope so. Because as I said in my Chronicle Review piece, there’s no doubt it’s time for a serious conversation about reading. Perhaps we can have a portion of it here on if:book.
Matthew Kirschenbaum
University of Maryland
Related: “the NEA’s misreading of reading”
Category Archives: NEA
NEA reading debate round 2: an exchange between sunil iyengar and nancy kaplan
Last week I received an email from Sunil Iyengar of the National Endownment for the Arts responding to Nancy Kaplan’s critique (published here on if:book) of the NEA’s handling of literacy data in its report “To Read or Not to Read.” I’m reproducing the letter followed by Nancy’s response.
Sunil Iyengar:
The National Endowment for the Arts welcomes a “careful and responsible” reading of the report, To Read or Not To Read, and the data used to generate it. Unfortunately, Nancy Kaplan’s critique (11/30/07) misconstrues the NEA’s presentation of Department of Education test data as a “distortion,” although all of the report’s charts are clearly and accurately labeled.
For example, in Charts 5A to 5D of the full report, the reader is invited to view long-term trends in the average reading score of students at ages 9, 13, and 17. The charts show test scores from 1984 through 2004. Why did we choose that interval? Simply because most of the trend data in the preceding chapters–starting with the NEA’s own study data featured in Chapter One–cover the same 20-year period. For the sake of consistency, Charts 5A to 5D refer to those years.
Dr. Kaplan notes that the Department of Education’s database contains reading score trends from 1971 onward. The NEA report also emphasizes this fact, in several places. In 2004, the report observes, the average reading score for 17-year-olds dipped back to where it was in 1971. “For more than 30 years…17-year-olds have not sustained improvements in reading scores,” the report states on p. 57. Nine-year-olds, by contrast, scored significantly higher in 2004 than in 1971.
Further, unlike the chart in Dr. Kaplan’s critique, the NEA’s Charts 5A to 5D explain that the “test years occurred at irregular intervals,” and each test year from 1984 to 2004 is provided. Also omitted from the critique’s reproduction are labels for the charts’ vertical axes, which provide 5-point rather than the 10-point intervals used by the Department of Education chart. Again, there is no mystery here. Five-point intervals were chosen to make the trends easier to read.
Dr. Kaplan makes another mistake in her analysis. She suggests that the NEA report is wrong to draw attention to declines in the average reading score of adult Americans of virtually every education level, and an overall decline in the percentage of adult readers who are proficient. But the Department of Education itself records these declines. In their separate reports, the NEA and the Department of Education each acknowledge that the average reading score of adults has remained unchanged. That’s because from 1992 to 2003, the percentage of adults with postsecondary education increased and the percentage who did not finish high school decreased. “After all,” the NEA report notes, “compared with adults who do not complete high school, adults with postsecondary education tend to attain higher prose scores.” Yet this fact in no way invalidates the finding that average reading scores and proficiency levels are declining even at the highest education levels.
“There is little evidence of an actual decline in literacy rates or proficiency,” Dr. Kaplan concludes. We respectfully disagree.
Sunil Iyengar
Director, Research & Analysis
National Endowment for the Arts
Nancy Kaplan:
I appreciate Mr. Iyengar’s engagement with issues at the level of data and am happy to acknowledge that the NEA’s report includes a single sentence on pages 55-56 with the crucial concession that over the entire period for which we have data, the average scale scores of 17 year-olds have not changed: “By 2004, the average scale score had retreated to 285, virtually the same score as in 1971, though not shown in the chart.” I will even concede the accuracy of the following sentence: “For more than 30 years, in other words, 17year-olds have not sustained improvements in reading scores” [emphasis in the original]. What the report fails to note or account for, however, is that there actually was a period of statistically significant improvement in scores for 17 year-olds from 1971 to 1984. Although I did not mention it in my original critique, the report handles data from 13 year-olds in the same way: “the scores for 13-year-olds have remained largely flat from 1984-2004, with no significant change between the 2004 average score and the scores from the preceding seven test years. Although not apparent from the chart, the 2004 score does represent a significant improvement over the 1971 average – ?a four-point increase” (p. 56).
In other words, a completely accurate and honest assessment of the data shows that reading proficiency among 17 year-olds has fluctuated over the past 30 years, but has not declined over that entire period. At the same time, reading proficiency among 9 year-olds and 13 year-olds has improved significantly. Why does the NEA not state the case in the simple, accurate and complete way I have just written? The answer Mr. Iyengar proffers is consistency, but that response may be a bit disingenuous.
Plenty of graphs in the NEA report show a variety of time periods, so there is at best a weak rationale for choosing 1984 as the starting point for the graphs in question. Consistency, in this case, is surely less important than accuracy and completeness. Given the inferences the report draws from the data, then, it is more likely that the sample of data the NEA used in its representations was chosen precisely because, as Mr. Iyengar admits, that sample would make “the trends easier to read.” My point is that the “trends” the report wants to foreground are not the only trends in the data: truncating the data set makes other, equally important trends literally invisible. A single sentence in the middle of a paragraph cannot excuse the act of erasure here. As both Edward Tufte (The Visual Display of Quantitative Information) and Jacques Bertin (Semiology of Graphics), the two most prominent authorities on graphical representations of data, demonstrate in their seminal works on the subject, selective representation of data constitutes distortion of that data.
Similarly, labels attached to a graph, even when they state that the tests occurred at irregular intervals, do not substitute for representing the irregularity of the intervals in the graph itself (again, see Tufte and Bertin). To do otherwise is to turn disinterested analysis into polemic. “Regularizing” the intervals in the graphic representation distorts the data.
The NEA report wants us to focus on a possible correlation between choosing to read books in one’s leisure time, reading proficiency, and a host of worthy social and civic activities. Fine. But if the reading scores of 17 year-olds improved from 1971 to 1984 but there is no evidence that during the period of improvement these youngsters were reading more, the case the NEA is trying to build becomes shaky at best. Similarly, the reading scores of 13 year-olds improved from 1971 to 1984 but “have remained largely flat from 1984-2004 ….” Yet during that same period, the NEA report claims, leisure reading among 13 year-olds was declining. So what exactly is the hypothesis here -? that sometimes declines in leisure reading correlate with declines in reading proficiency but sometimes such a decline is not accompanied by a decline in reading proficiency? I’m skeptical.
My critique is aimed at the management of data (rather than the a-historical definition of reading the NEA employs, a somewhat richer and more potent issue joined by Matthew Kirschenbaum and others) because I believe that a crucial component of contemporary literacy, in its most capacious sense, includes the ability to understand the relationships between claims, evidence and the warrants for that evidence. The NEA’s data need to be read with great care and its argument held to a high scientific standard lest we promulgate worthless or wasteful public policy based on weak research.
I am a humanist by training and so have come to my appreciation of quantitative studies rather late in my intellectual life. I cannot claim to have a deep understanding of statistics, yet I know what “confounding factors” are. When the NEA report chooses to claim that the reading proficiency of adults is declining while at the same time ignoring the NCES explanation of the statistical paradox that explains the data, it is difficult to avoid the conclusion that the report’s authors are not engaging in a disinterested (that is, dispassionate) exploration of what we can know about the state of literacy in America today but are instead cherry-picking the elements that best suit the case they want to make.
Nancy Kaplan, Executive Director
School of Information Arts and Technologies
University of Baltimore
reading responsibly: nancy kaplan on the NEA’s data distortion
The following critique, which expands upon a comment left late yesterday, is from Nancy Kaplan, Executive Director of the School of Information Arts and Technologies at the University of Baltimore.
Analyzing long term trends in Americans’ reading habits, To Read or Not to Read argues that three important trends produce a worrying prognosis for the future of reading, and indeed the future of civic life:
1. a historical decline in voluntary reading rates among teenagers and young adults;
2. a gradual worsening of reading skills among older teens;
3. and declining proficiency in adult readers.
These three trends provide the foundations for the central argument of the report, which can be summarized fairly succinctly:
Reading books in one’s leisure time strongly correlates with reading proficiency so that when rates of voluntary book-reading decline and we also see a decline in reading proficiency, it is reasonable to suppose that people become less proficient readers because they are spending less time reading books for pleasure.
The entire argument, in short, depends on the ability to demonstrate both that reading proficiency is declining and that the number of people who choose to read books in their leisure time is also declining. From those two trends, the NEA draws some inferences about what declines in reading books and declines in reading proficiency mean for the nation as a whole.
Much of the data used to support the core claims derives from statistics gathered and analyzed by the National Center for Education Statistics (NCES). In particular, data on reading proficiency at three ages -? 9, 13, and 17 -? come from the National Assessment of Educational Progress (NAEP) report on long term trends, a “nationally representative and continuing assessment of what America’s students know and can do in various subject areas. Assessments are conducted periodically [since 1971] in mathematics, reading, science, writing, the arts, civics, economics, geography, and U.S. history” (http://nces.ed.gov/nationsreportcard/about/). In addition to assessing reading proficiency across three contexts for reading (“reading for literary experience, reading for information, and reading to perform a task”), the assessment also “asked students to report contextual variables such as time spent on homework, the number of pages read for school and homework, and the amount of time spent reading for fun” (TRONTR, p. 27). Data demonstrating the decline in reading proficiency among adult readers come from a separate NCES study, the National Assessments of Adult Literacy (NAAL), which has been conducted periodically since 1992.
Despite the numerous charts, graphs and tables in To Read or Not ot Read, a careful and responsible reading of the complete data provided by the NAEP and the NAAL undermine the conclusions the NEA draws. Two examples of problematic uses of primary data sets will illustrate the issues.
The graph below shows the original data as it is displayed on the NCES web site (http://nces.ed.gov/nationsreportcard/images/ltt/ss01.gif) with the NEA’s truncated and reformatted version superimposed above the original:
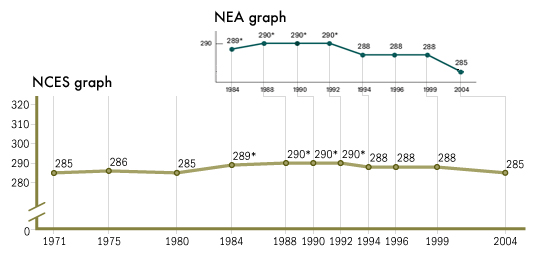
Although the data represented in the NEA version are strictly speaking accurate, they nevertheless seriously distort the data set from which they were derived in two key ways: by truncating the data set and by representing irregular time intervals with regularized spatial intervals. The first distortion creates a trend where none exists. The second distortion magnifies the effect of the decline in scores by making the slope of the line between the scores in 1999 and the scores in 2004 steeper than it should be. The steeper slope, then, suggests a more rapid and deeper decline than the underlying data support.
Note that the NEA graph begins with the year 1984 while the data set from NCES begins in 1971. Note too that the average scale score for 17 year olds in 2004 -? 285 -? is exactly the same as the average scale score for that age group in 1971. In other words, over the whole period for which data are available, there has been no change in reading proficiency among 17 year olds, although there was evidently a brief period of significant improvement between 1984 and 1992 (the asterisks mark statistically significant differences with the 2004 score). In short, there is no downward trend in reading proficiency over the whole period for which we have data. The downturn that did occur after scores peaked from 1988 through 1992 is statistically significant but it is on the whole not very steep nor particularly precipitous. In fact the magnitude and duration of the decline mirror the statistically significant uptick in scores over the four year period from 1980 to 1984.
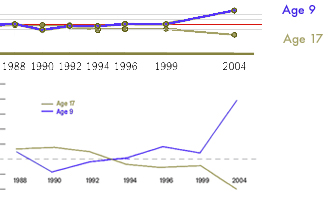
A second graph produced by the NEA and used both in the executive summary and in Chapter 5 of the report highlights and magnifies both kinds of distortions. The graph uses a truncated set of the NCES data for two age groups -? 17 year old students and 9 year old students -? to exaggerate the difference in trends between the two groups. The underlying data are represented on the NCES graph at the top of the illustration. The green dots and line represent the relative changes in scores for 17 year olds from 1988 to 2004 and the blue line represents the relative changes for 9 year olds. The horizontal red line is the base 1988 score for each group. The 9 year old groups’ score is 7 points higher in 2004 than it was in 1988 while the 17 year old groups’ score is 5 points lower. In the NEA graph for these same data, the scale has been altered to create the impression that score differences are much greater than they actually are. The dramatic improvement in the scores of 9 year old readers is statistically significant, as is the 5 point decline in scores for 17 year olds over the period shown in the graphs. Yet in the NEA revision of the NCES graph, the data points for each test year are spaced evenly across the x-axis even though the tests occurred at uneven intervals. As a result, the changes in scores for both groups are made to seem much more dramatic and sudden than they really are.
Misleading graphs based on manipulated data are not the only fudge factor the NEA employs. In addition to relying on two sources of NAEP data, To Read or Not to Read also uses data from the National Assessment of Adult Literacy whose latest report, Literacy in Everyday Life, provides a nuanced and detailed analysis of adult literacy in America over 11 years (1992-2003). Despite the complexity of its subject and the detailed data it provides, the NAAL report begins with a clear and simple assertion: “between 1992 and 2003, there were no statistically significant changes in average prose … literacy for the total population ages 16 and older…” (p. iv). Even though the overall picture did not change, the NAAL did report some data that, when removed from the larger picture, appear to suggest declines in adult proficiency. As the NEA notes, proficiency among adults with bachelor’s degrees and post-graduate degrees declined in statistically significant measures. But the NAAL report explains the apparent contradiction by noting that underlying demographic changes account for the fact that overall proficiency did not decline while levels of proficiency among the more highly educated appear to have decreased:
The fact that average prose literacy decreased or remained the same for all levels of highest educational attainment raises an interesting questiion. How could prose literacy scores decrease at every level of education beyond high school without a decrease in the overall score? This pattern is called Simpson’s Paradox. The answer is that the relative size of the groups changed. From 1992 to 2003, the percentage of adults with postsecondary education increased and the percentage of adults who did not complete high school decreased. The increase in the percentage of adults with postsecondary education, who, on average, had higher prose scores than adults who did not complete high school, offsets the fact that average prose literacy scores declined at every level of educational attainment beyond high school. (p. 37).
Among other things, the NAAL report finds that various demographic factors, especially an adult’s first language and the age at which that person learned English, have significant effects on proficiency with literacy in English. A quick look at changes in population over the same period provides a reasonable hypothesis to explain the NAAL data. Over the period measured in the latest report, the US has experienced large increases in immigrant populations. For example, in 1990, 7.9% of the total US population were foreign born; in 2000, the 11.1% of the population were immigrants. The overwhelming majority of foreign born residents of the US (97% of naturlized citizens and 84% of all other foreign born residents) are adults. Such changes in the make-up of the population might have important effects on the data.
Data may be one kind of thing but polemic is another. The heart of the NEA’s case appears not in the report proper but in preface provided by the Endowment’s Chairman, Dana Gioia. There he explicitly asserts that reading books, preferrably every day, produces more prosperous and more virtuous citizens:
Strictly understood, the data in this report do not necessarily show cause and effect. The statistics merely indicate correlations. The habit of daily reading, for instance, overwhelmingly correlates with better reading skills and higher academic achievement. On the other hand, poor reading skills correlate with lower levels of financial and job success. At the risk of being criticized by social scientists, I suggest that since all the data demonstrate consistent and mostly linear relationships between reading and these positive results – ?and between poor reading and negative results -? reading has played a decisive factor. Whether or not people read, and indeed how much and how often they read, affects their lives in crucial ways.
All of the data suggest how powerfully reading transforms the lives of individuals – ?whatever their social circumstances. Regular reading not only boosts the likelihood of an individual’s academic and economic success – ?facts that are not especially surprising – ?but it also seems to awaken a person’s social and civic sense. Reading correlates with almost every measurement of positive personal and social behavior surveyed. It is reassuring, though hardly amazing, that readers attend more concerts and theater than non-readers, but it is surprising that they exercise more and play more sports – ?no matter what their educational level. The cold statistics confirm something that most readers know but have mostly been reluctant to declare as fact – ? books change lives for the better.
There is little doubt that modern information economies require many more proficient readers than older industrial economies did. Because of changes in the nature and conditions of work, declining proficiency in reading among American adults might cause some concern if not alarm. It is surely also the case that educational institutions at every level can and should do a better job. Yet there is little evidence of an actual decline in literacy rates or proficiency. As a result, the NEA’s core argument breaks down. Even if we assume that high school seniors in 1971 spent more of their leisure time reading books than today’s high school seniors do (although there is no data going back far enough to support the case one way or the other), there simply is no evidence that today’s youngsters don’t read as well as Mr. Gioia’s peers did at a comparable age. From the information available, we simply cannot construct any relationship, let alone a causal one, between voluntary reading of books and reading proficiency.
Reading well, doing well, and doing good may exhibit strong correlations but the underlying dynamics producing each of the three effects may have little to do with what Americans choose to do in their leisure time. Read responsibly, the data underlying the NEA’s latest report simply do not support Mr. Gioia’s assertions.
Like many other federal agencies under our current political regime, the National Endowment for the Arts seems to have fixed the data to fit its desired conclusions.
the NEA’s misreading of reading
 Matthew G. Kirschenbaum writes an elegant and concise critique of the National Endowment for the Arts’ ominously titled new study of American reading trends, “To Read or Not to Read: A Question of National Consequence”, which is a sequel to their 2004 opus “Reading at Risk.” The basic argument is that reading, or what they rather awkwardly refer to as “voluntary reading” (that is, reading done purely for pleasure or self-improvement) is in a precipitious state of decline, especially among the young -? a situation which poses a grave threat to our culture, democracy and civic fabric.
Though clearly offered with the best of intentions, the report demonstrates an astonishingly simplistic view of what reading is and where it is and isn’t occurring. Overflowing with bar graphs and and charts measuring hours and minutes spent reading within various age brackets, the study tries to let statistics do the persuading, but fails at almost every turn to put these numbers in their proper social or historical context, or to measure them adequately against other widespread forms of reading taking place on computers and the net.
The study speaks, as Kirschenbaum puts it, “as though there is but a single, idealized model of reading from which we have strayed” -? a liesurely, literary sort of reading embodied by that classic image of the solitary reader hunched over a book in deep concentration. Kirschenbaum rightly argues that this way of reading is simply one of a complicated and varied set of behaviors that have historically operated around texts. More to the point, many of these alternative forms -? skimming, browsing, lateral reading, non-linear reading, reading which involves writing (glossing, annotation etc.) to name some -? today happen increasingly in digital contexts, constituting what Kirschenbaum refers to broadly as a grand “remaking of reading.” The NEA document takes little of this into account. Kirschenbaum:
…while the authors of the report repeatedly emphasize that they include online reading in their data, the report sounds most clumsy and out of touch when referring to new media. The authors of the report tend to homogenize “the computer” without acknowledging the diversity of activity -? and the diversity of reading -? that takes place on its screen. Our screens are spaces where new forms like blogs and e-mail and chats commingle with remediations of older forms, like newspapers and magazines -? or even poems, stories, and novels. Reading your friend’s blog is not likely a replacement for reading Proust, but some blogs have been a venue for extraordinary writing, and we are not going to talk responsibly or well about what it means to read online until we stop conflating genre with value.
The report also fails to acknowledge the extent to which reading and writing have become commingled in electronic venues. The staccato rhythms of a real-time chat session are emblematic in this regard: Reading and writing all but collapse into a single unified activity. But there is a spectrum of writing online, just as there is a spectrum of reading, and more and more applications blur the line between the two.
(He goes on to mention CommentPress and a number of other networked reading applications…)
There’s certainly cause for concern about what might be lost as deep extended reading of deep extensive books declines, and in their crude way the NEA’s stats and figures do tell a worrying tale of shifting cultural priorities. Indeed, the most appealing aspect of “To Read or Not to Read” is its passionate commitment to a set of humanistic values: sustained thinking, personal and moral growth, a critical outlook, the cultivation of knowledge. Few would disagree that these are things that ought to be held onto in the face of relentless technological change and a rapacious commercial culture, but to insist that the book and one particular romanticized notion of reading must be the sole vessels for transporting these values into the future seems both naive and needlessly limiting.
You could say that our group’s mission is to advocate for these same values -? values that we certainly associate with books, hence our name -? but in the diverse landscape of new media. To the question “to read or not to read” we answer emphatically “to read!” But to understand what reading actually is demands a more nuanced investigation.