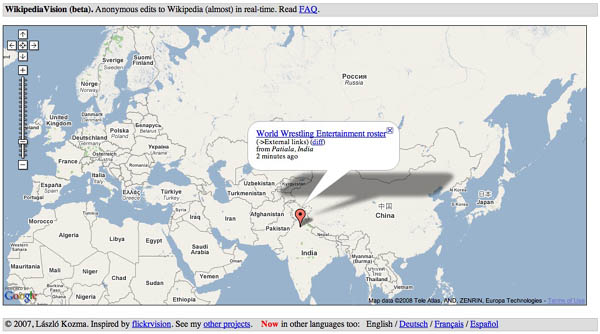
Markers move around the map registering Wikipedia edits in close to real time. Weirdly compelling.
Category Archives: maps
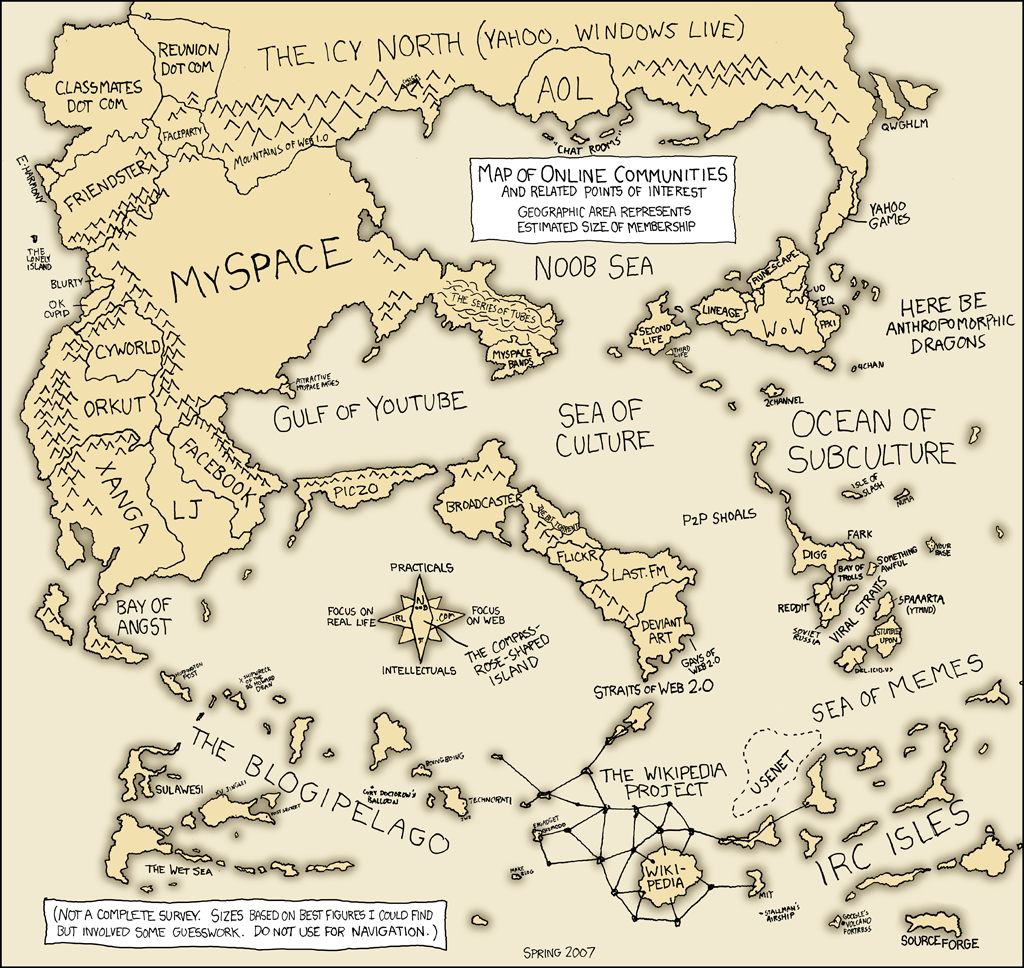
map of online communities
terrain as browsing mechanism
Ben’s post last week, book as terrain, about converting any image to an interactive map with hotspots contained a link to a blog which collects info about all sorts of google map mashups. Ben’s post was about using book pages as geographic jumping-off points. However, as i read the endlessly fascinating list of other sorts of mashups it occurred to me that in addition to “book as terrain” we could also look at the idea of “Google map mashups” as a genuinely new form of expression. As I read through the wonderfully annotated list I realized that they cover the full gamut of subjects you would find in a bookstore . . . . Fiction, Non-Fiction, Travel, History, Sports, Games, Religion, Personal Growth, and Crime.
It’s interesting to realize that as our experience moves relentlessly into the virtual domain, that geography, which in the past was firmly rooted in the “real,” increasingly becomes the mechanism for organizing our activiites in virtual space.
google on mars
Apparently, this came out in March, but I ‘ve only just stumbled on it now. Google has a version of its maps program for the planet Mars, or at least the part of if explored and documented by the 2001 NASA Mars Odyssey mission. It’s quite spectacular, especially the psychedelic elevation view:
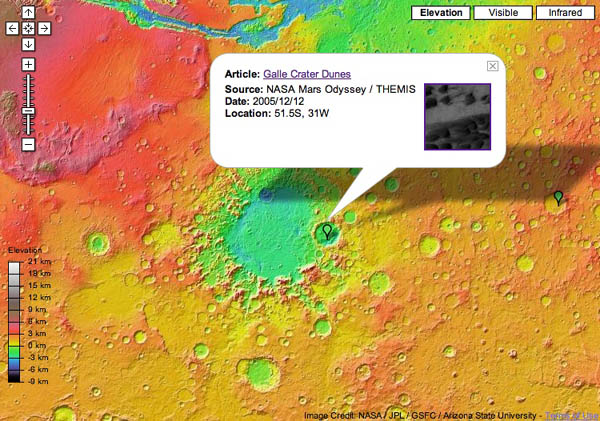
There’s also various info tied to specific coordinates on the map: location of dunes, craters, planes etc., as well as stories from the Odyssey mission, mostly descriptions of the Martian landscape. It would be fun to do an anthology of Mars-located science fiction with the table of contents mapped, or an edition of Bradbury’s Martian Chronicles. Though I suppose there’d a fair bit of retrofitting of the atlas to tales written out of pure fancy and not much knowledge of Martian geography (Marsography?). If nothing else, there’s the seeds of a great textbook here. Does the Google Maps API extend to Mars, or is it just an earth thing?
mapping books
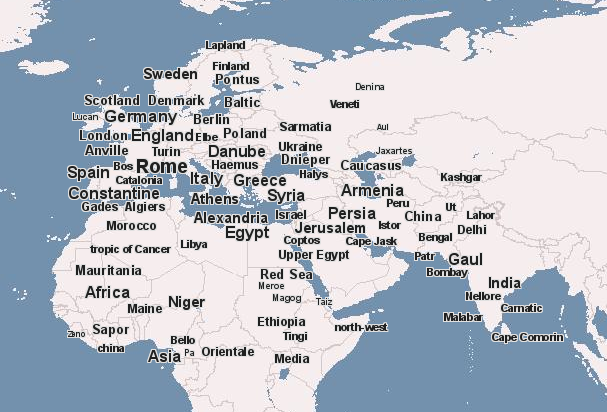
Gutenkarte is an effort to map books by MetaCarta. The website takes text from books in Project Gutenberg, searches them for the appearance of place names, and plots them on a map of the world using their own GeoParser API, creating an astonishing visualization of the world described in a text. Here, for example, is a map of Edward Gibbon’s Decline and Fall of the Roman Empire:
(Click on the picture to view the live map.) It’s not perfect yet: note that “china” is in the Ivory Coast, and “Asia” seems to be located just off the coast of Cameroon. But the map does give an immediate sense of the range of Gibbon’s book: in this case, the extent of the Roman world. The project is still in its infancy: eventually, users will be able to correct mistakes.
Gutenkarte suggests ways of looking at texts not dissimilar from that of Franco Moretti, who in last year’s Graphs, Maps, Trees: Abstract Models for Literary History (discussed by The Valve here) discussed how making maps of places represented in literature could afford a new way of discussing texts. Here, for example, is a map he constructed of Parisian love affairs in the novel, demonstrating that lovers were usually separated by the Seine:
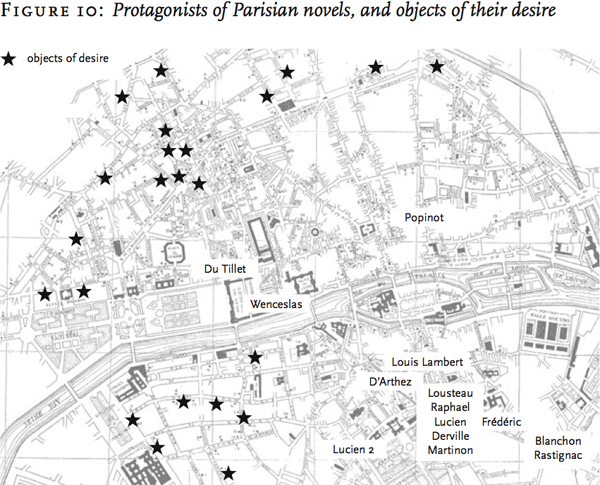
(from the “Maps” chapter, online here if you have university access to the New Left Review.) Moretti constructed his maps by hand, with the help of grad student labor; it will be interesting to see if Gutenkarte will make this sort of visualization accessible to all.
katrina and the interactive atlas
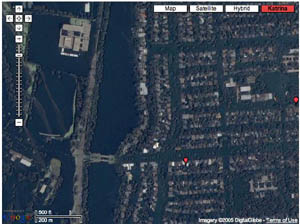
Interactive maps help those of us not in the region to grasp the terrain of devastation wrought by Hurricane Katrina. These maps are suggestive of a new paradigm for the digital page – an interactive canvas, or territory, through which the reader can zoom through orders of magnitude.
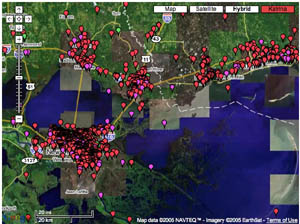
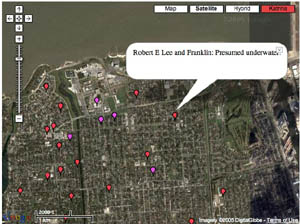
Most talked about is the “visual wiki” at scipionus.com – a re-tooling of Google maps that invites users to post tabs with information pertaining to specific locales (as fine-grained as streetcorners). Tabs are editable and are supposed to be used only for concrete reports, though many have posted pleas for news of specific missing persons or of the condition of certain blocks. Some samples:
“Saw news video 9/2/05 of corner street sign at 10th St. & Pontchartrain Blvd. Water level was about 6 in. below. green street signs.”
“the Ashley’s are in Prattville AL”
“4400 Calumet — dry on Weds?”
“as of 5:00 pm.. the streets from wilson canal to transcontinental are COMPLETELY DRY! source from somebody who stayed and called to tell us the info.”
“Dylan Nash anyone?? call 919-7307018”
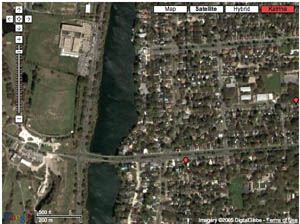
The maps include post-Katrina satellite imagery, which reveals, upon zooming in, horrifying grids of inundated streets, stadiums filled up like soup tureens, city parks transformed into swamps. Wired recently ran a piece about sciponius.
Before & After:
I was also impressed by the interactive maps on washingtonpost.com.
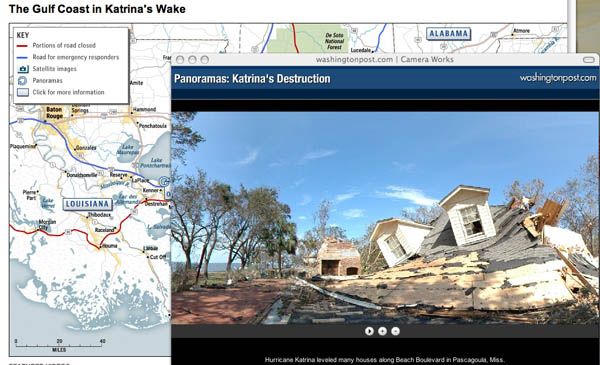
Click on spinning wheels at various points along the coastline and windows pop up with scrolling panoramic shots. Quite stunning. You can click the screen and drag the scroll in either direction, stop it, speed it up, and even pull it up and down to reveal glimpses of the sky or ground. Photojournalism is given new room to play on online newspapers.
(No Need to Click Here – I’m just claiming my feed at Feedster feedster:d50fedfc363272797584521a06a79da5)

