Interactive maps help those of us not in the region to grasp the terrain of devastation wrought by Hurricane Katrina. These maps are suggestive of a new paradigm for the digital page – an interactive canvas, or territory, through which the reader can zoom through orders of magnitude.
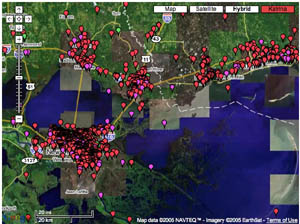
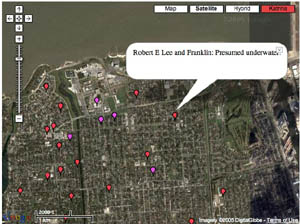
Most talked about is the “visual wiki” at scipionus.com – a re-tooling of Google maps that invites users to post tabs with information pertaining to specific locales (as fine-grained as streetcorners). Tabs are editable and are supposed to be used only for concrete reports, though many have posted pleas for news of specific missing persons or of the condition of certain blocks. Some samples:
“Saw news video 9/2/05 of corner street sign at 10th St. & Pontchartrain Blvd. Water level was about 6 in. below. green street signs.”
“the Ashley’s are in Prattville AL”
“4400 Calumet — dry on Weds?”
“as of 5:00 pm.. the streets from wilson canal to transcontinental are COMPLETELY DRY! source from somebody who stayed and called to tell us the info.”
“Dylan Nash anyone?? call 919-7307018”
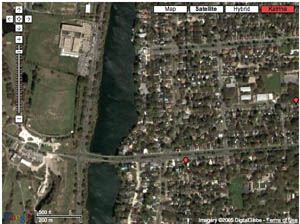
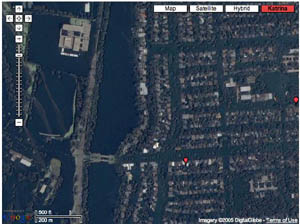
The maps include post-Katrina satellite imagery, which reveals, upon zooming in, horrifying grids of inundated streets, stadiums filled up like soup tureens, city parks transformed into swamps. Wired recently ran a piece about sciponius.
Before & After:
I was also impressed by the interactive maps on washingtonpost.com.
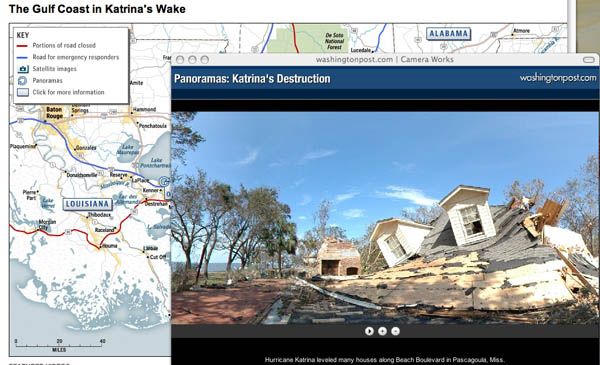
Click on spinning wheels at various points along the coastline and windows pop up with scrolling panoramic shots. Quite stunning. You can click the screen and drag the scroll in either direction, stop it, speed it up, and even pull it up and down to reveal glimpses of the sky or ground. Photojournalism is given new room to play on online newspapers.
(No Need to Click Here – I’m just claiming my feed at Feedster feedster:d50fedfc363272797584521a06a79da5)
