What does the evolution of a complex, multi-authored document look like over time? Below are revision histories of two Wikipedia articles, “Brazil” and “love,” as rendered by History Flow Visualization, a new application from alphaWorks, the emerging technologies division at IBM.
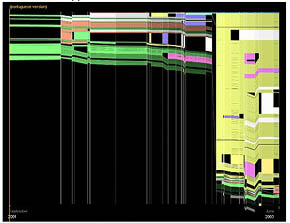
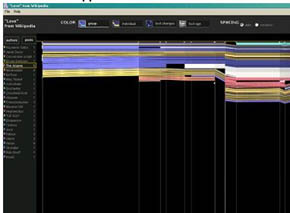
Changes are depicted as parallelograms along two axes, the vertical axis representing the document’s length, and the horizontal axis representing time. The tool offers “community” or single-author views, and uses color to emphasize or isolate specific information – i.e. to distinguish authors, or to measure age of a contribution. (view screenshots)
If you open Wikipedia’s revision history of the Brazil article, you find a daunting list of hundreds of recorded changes. It’s hard to get any sense of how this history compares in overall shape, complexity, and pattern of growth to that of love. But with the alphaWorks tool, it’s clear at a glance that the Brazil article almost tripled in size in 2003, and seems to have been suddenly saturated in yellow (perhaps representing the preponderant influence of a single author?). We’re looking not at a list, but a situation: in 2003, a self-designated authority on Brazil swaggered in and assumed leadership of the country’s wiki-destiny, whereas love seems to have grown at a fairly constant rate with a pretty consistent mix of contributors – no swaggering, yellow Brazilians.
I’d say that the alphaWorks tool suggests something powerful, but is probably of limited use. It’s good at providing the quick glance, but seems a little too mashed and muddled for line-by-line analysis. Good visualization tools are those that give a sense of the whole but also allow for minute investigation. At their best, they convey information meaningfully, even movingly. Nurturing a complex, multi-authored work is in some ways like raising a child. You mark its height against the wall, take photographs, file away old homework assignments, gather artifacts – in short, you construct a history, of “a hundred indecisions..and..a hundred visions and revisions.”
(from Slashdot via reBlog)
if:book
A Project of the Institute for the Future of the Book

Wikis over time
IBM’s alphaWorks has release a new tool that will allow you to visualize the history of a Wiki document. This is really cool. It’s written in Java, and it appears to be available for license, though I’m not sure under what terms. There is a plug-in for…