
The following critique, which expands upon a comment left late yesterday, is from Nancy Kaplan, Executive Director of the School of Information Arts and Technologies at the University of Baltimore.
Analyzing long term trends in Americans’ reading habits, To Read or Not to Read argues that three important trends produce a worrying prognosis for the future of reading, and indeed the future of civic life:
1. a historical decline in voluntary reading rates among teenagers and young adults;
2. a gradual worsening of reading skills among older teens;
3. and declining proficiency in adult readers.
These three trends provide the foundations for the central argument of the report, which can be summarized fairly succinctly:
Reading books in one’s leisure time strongly correlates with reading proficiency so that when rates of voluntary book-reading decline and we also see a decline in reading proficiency, it is reasonable to suppose that people become less proficient readers because they are spending less time reading books for pleasure.
The entire argument, in short, depends on the ability to demonstrate both that reading proficiency is declining and that the number of people who choose to read books in their leisure time is also declining. From those two trends, the NEA draws some inferences about what declines in reading books and declines in reading proficiency mean for the nation as a whole.
Much of the data used to support the core claims derives from statistics gathered and analyzed by the National Center for Education Statistics (NCES). In particular, data on reading proficiency at three ages -? 9, 13, and 17 -? come from the National Assessment of Educational Progress (NAEP) report on long term trends, a “nationally representative and continuing assessment of what America’s students know and can do in various subject areas. Assessments are conducted periodically [since 1971] in mathematics, reading, science, writing, the arts, civics, economics, geography, and U.S. history” (http://nces.ed.gov/nationsreportcard/about/). In addition to assessing reading proficiency across three contexts for reading (“reading for literary experience, reading for information, and reading to perform a task”), the assessment also “asked students to report contextual variables such as time spent on homework, the number of pages read for school and homework, and the amount of time spent reading for fun” (TRONTR, p. 27). Data demonstrating the decline in reading proficiency among adult readers come from a separate NCES study, the National Assessments of Adult Literacy (NAAL), which has been conducted periodically since 1992.
Despite the numerous charts, graphs and tables in To Read or Not ot Read, a careful and responsible reading of the complete data provided by the NAEP and the NAAL undermine the conclusions the NEA draws. Two examples of problematic uses of primary data sets will illustrate the issues.
The graph below shows the original data as it is displayed on the NCES web site (http://nces.ed.gov/nationsreportcard/images/ltt/ss01.gif) with the NEA’s truncated and reformatted version superimposed above the original:
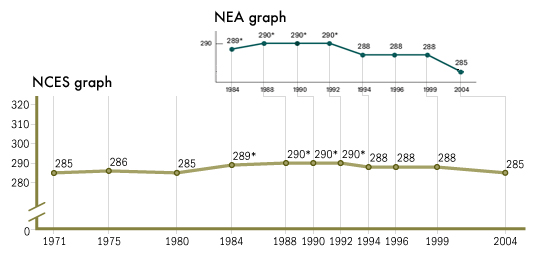
Although the data represented in the NEA version are strictly speaking accurate, they nevertheless seriously distort the data set from which they were derived in two key ways: by truncating the data set and by representing irregular time intervals with regularized spatial intervals. The first distortion creates a trend where none exists. The second distortion magnifies the effect of the decline in scores by making the slope of the line between the scores in 1999 and the scores in 2004 steeper than it should be. The steeper slope, then, suggests a more rapid and deeper decline than the underlying data support.
Note that the NEA graph begins with the year 1984 while the data set from NCES begins in 1971. Note too that the average scale score for 17 year olds in 2004 -? 285 -? is exactly the same as the average scale score for that age group in 1971. In other words, over the whole period for which data are available, there has been no change in reading proficiency among 17 year olds, although there was evidently a brief period of significant improvement between 1984 and 1992 (the asterisks mark statistically significant differences with the 2004 score). In short, there is no downward trend in reading proficiency over the whole period for which we have data. The downturn that did occur after scores peaked from 1988 through 1992 is statistically significant but it is on the whole not very steep nor particularly precipitous. In fact the magnitude and duration of the decline mirror the statistically significant uptick in scores over the four year period from 1980 to 1984.
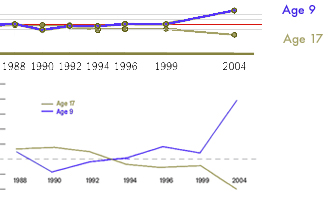
A second graph produced by the NEA and used both in the executive summary and in Chapter 5 of the report highlights and magnifies both kinds of distortions. The graph uses a truncated set of the NCES data for two age groups -? 17 year old students and 9 year old students -? to exaggerate the difference in trends between the two groups. The underlying data are represented on the NCES graph at the top of the illustration. The green dots and line represent the relative changes in scores for 17 year olds from 1988 to 2004 and the blue line represents the relative changes for 9 year olds. The horizontal red line is the base 1988 score for each group. The 9 year old groups’ score is 7 points higher in 2004 than it was in 1988 while the 17 year old groups’ score is 5 points lower. In the NEA graph for these same data, the scale has been altered to create the impression that score differences are much greater than they actually are. The dramatic improvement in the scores of 9 year old readers is statistically significant, as is the 5 point decline in scores for 17 year olds over the period shown in the graphs. Yet in the NEA revision of the NCES graph, the data points for each test year are spaced evenly across the x-axis even though the tests occurred at uneven intervals. As a result, the changes in scores for both groups are made to seem much more dramatic and sudden than they really are.
Misleading graphs based on manipulated data are not the only fudge factor the NEA employs. In addition to relying on two sources of NAEP data, To Read or Not to Read also uses data from the National Assessment of Adult Literacy whose latest report, Literacy in Everyday Life, provides a nuanced and detailed analysis of adult literacy in America over 11 years (1992-2003). Despite the complexity of its subject and the detailed data it provides, the NAAL report begins with a clear and simple assertion: “between 1992 and 2003, there were no statistically significant changes in average prose … literacy for the total population ages 16 and older…” (p. iv). Even though the overall picture did not change, the NAAL did report some data that, when removed from the larger picture, appear to suggest declines in adult proficiency. As the NEA notes, proficiency among adults with bachelor’s degrees and post-graduate degrees declined in statistically significant measures. But the NAAL report explains the apparent contradiction by noting that underlying demographic changes account for the fact that overall proficiency did not decline while levels of proficiency among the more highly educated appear to have decreased:
The fact that average prose literacy decreased or remained the same for all levels of highest educational attainment raises an interesting questiion. How could prose literacy scores decrease at every level of education beyond high school without a decrease in the overall score? This pattern is called Simpson’s Paradox. The answer is that the relative size of the groups changed. From 1992 to 2003, the percentage of adults with postsecondary education increased and the percentage of adults who did not complete high school decreased. The increase in the percentage of adults with postsecondary education, who, on average, had higher prose scores than adults who did not complete high school, offsets the fact that average prose literacy scores declined at every level of educational attainment beyond high school. (p. 37).
Among other things, the NAAL report finds that various demographic factors, especially an adult’s first language and the age at which that person learned English, have significant effects on proficiency with literacy in English. A quick look at changes in population over the same period provides a reasonable hypothesis to explain the NAAL data. Over the period measured in the latest report, the US has experienced large increases in immigrant populations. For example, in 1990, 7.9% of the total US population were foreign born; in 2000, the 11.1% of the population were immigrants. The overwhelming majority of foreign born residents of the US (97% of naturlized citizens and 84% of all other foreign born residents) are adults. Such changes in the make-up of the population might have important effects on the data.
Data may be one kind of thing but polemic is another. The heart of the NEA’s case appears not in the report proper but in preface provided by the Endowment’s Chairman, Dana Gioia. There he explicitly asserts that reading books, preferrably every day, produces more prosperous and more virtuous citizens:
Strictly understood, the data in this report do not necessarily show cause and effect. The statistics merely indicate correlations. The habit of daily reading, for instance, overwhelmingly correlates with better reading skills and higher academic achievement. On the other hand, poor reading skills correlate with lower levels of financial and job success. At the risk of being criticized by social scientists, I suggest that since all the data demonstrate consistent and mostly linear relationships between reading and these positive results – ?and between poor reading and negative results -? reading has played a decisive factor. Whether or not people read, and indeed how much and how often they read, affects their lives in crucial ways.
All of the data suggest how powerfully reading transforms the lives of individuals – ?whatever their social circumstances. Regular reading not only boosts the likelihood of an individual’s academic and economic success – ?facts that are not especially surprising – ?but it also seems to awaken a person’s social and civic sense. Reading correlates with almost every measurement of positive personal and social behavior surveyed. It is reassuring, though hardly amazing, that readers attend more concerts and theater than non-readers, but it is surprising that they exercise more and play more sports – ?no matter what their educational level. The cold statistics confirm something that most readers know but have mostly been reluctant to declare as fact – ? books change lives for the better.
There is little doubt that modern information economies require many more proficient readers than older industrial economies did. Because of changes in the nature and conditions of work, declining proficiency in reading among American adults might cause some concern if not alarm. It is surely also the case that educational institutions at every level can and should do a better job. Yet there is little evidence of an actual decline in literacy rates or proficiency. As a result, the NEA’s core argument breaks down. Even if we assume that high school seniors in 1971 spent more of their leisure time reading books than today’s high school seniors do (although there is no data going back far enough to support the case one way or the other), there simply is no evidence that today’s youngsters don’t read as well as Mr. Gioia’s peers did at a comparable age. From the information available, we simply cannot construct any relationship, let alone a causal one, between voluntary reading of books and reading proficiency.
Reading well, doing well, and doing good may exhibit strong correlations but the underlying dynamics producing each of the three effects may have little to do with what Americans choose to do in their leisure time. Read responsibly, the data underlying the NEA’s latest report simply do not support Mr. Gioia’s assertions.
Like many other federal agencies under our current political regime, the National Endowment for the Arts seems to have fixed the data to fit its desired conclusions.